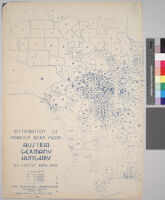
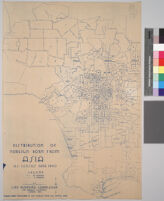
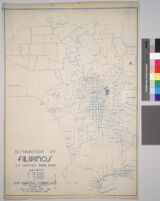
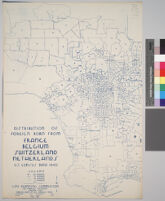
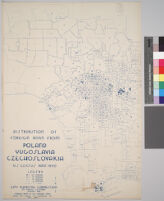
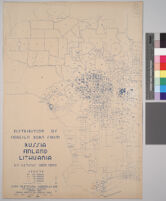
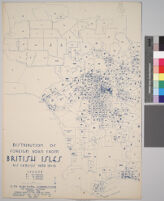
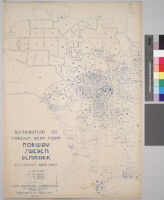
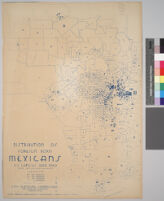
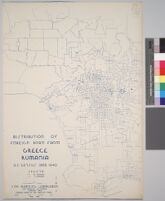
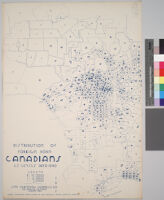
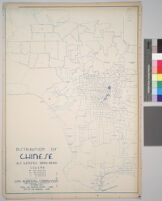
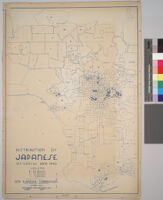
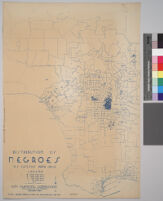
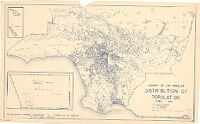
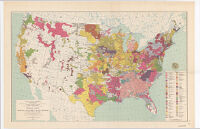
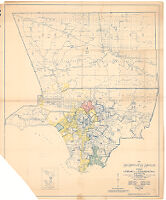
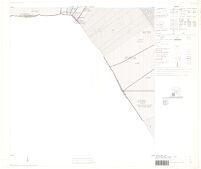
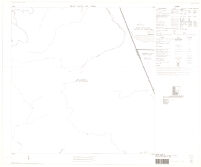
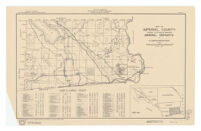
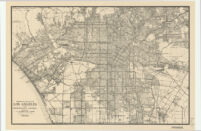
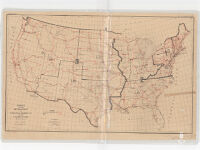
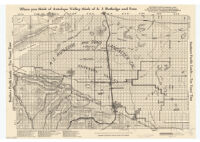
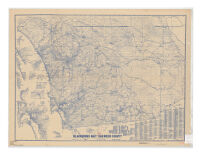
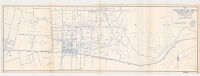
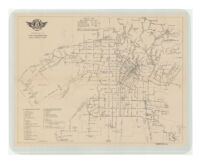
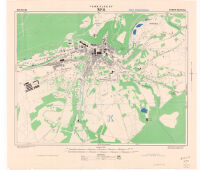
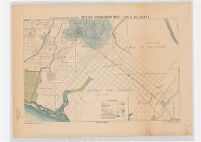
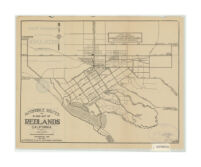
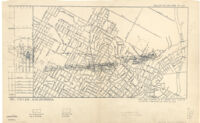
All maps use the same grid, showing cities and towns in Los Angeles County, as well as boundary lines of the adjoining counties and some features and delineations of cities surrounding LA County (within the map's borders). A legend of various sized dots is given for each map, from the largest dot representing the highest population figure per dot to the smallest dot representing the smallest population figure this number varies per map. In rare cases, some population figures are represented by dots for some of the adjoining (non-LA County) cities
All maps use the same grid, showing cities and towns in Los Angeles County, as well as boundary lines of the adjoining counties and some features and delineations of cities surrounding LA County (within the map's borders). A legend of various sized dots is given for each map, from the largest dot representing the highest population figure per dot to the smallest dot representing the smallest population figure this number varies per map. In rare cases, some population figures are represented by dots for some of the adjoining (non-LA County) cities
All maps use the same grid, showing cities and towns in Los Angeles County, as well as boundary lines of the adjoining counties and some features and delineations of cities surrounding LA County (within the map's borders). A legend of various sized dots is given for each map, from the largest dot representing the highest population figure per dot to the smallest dot representing the smallest population figure this number varies per map. In rare cases, some population figures are represented by dots for some of the adjoining (non-LA County) cities
All maps use the same grid, showing cities and towns in Los Angeles County, as well as boundary lines of the adjoining counties and some features and delineations of cities surrounding LA County (within the map's borders). A legend of various sized dots is given for each map, from the largest dot representing the highest population figure per dot to the smallest dot representing the smallest population figure this number varies per map. In rare cases, some population figures are represented by dots for some of the adjoining (non-LA County) cities
All maps use the same grid, showing cities and towns in Los Angeles County, as well as boundary lines of the adjoining counties and some features and delineations of cities surrounding LA County (within the map's borders). A legend of various sized dots is given for each map, from the largest dot representing the highest population figure per dot to the smallest dot representing the smallest population figure this number varies per map. In rare cases, some population figures are represented by dots for some of the adjoining (non-LA County) cities
All maps use the same grid, showing cities and towns in Los Angeles County, as well as boundary lines of the adjoining counties and some features and delineations of cities surrounding LA County (within the map's borders). A legend of various sized dots is given for each map, from the largest dot representing the highest population figure per dot to the smallest dot representing the smallest population figure this number varies per map. In rare cases, some population figures are represented by dots for some of the adjoining (non-LA County) cities
All maps use the same grid, showing cities and towns in Los Angeles County, as well as boundary lines of the adjoining counties and some features and delineations of cities surrounding LA County (within the map's borders). A legend of various sized dots is given for each map, from the largest dot representing the highest population figure per dot to the smallest dot representing the smallest population figure this number varies per map. In rare cases, some population figures are represented by dots for some of the adjoining (non-LA County) cities
All maps use the same grid, showing cities and towns in Los Angeles County, as well as boundary lines of the adjoining counties and some features and delineations of cities surrounding LA County (within the map's borders). A legend of various sized dots is given for each map, from the largest dot representing the highest population figure per dot to the smallest dot representing the smallest population figure this number varies per map. In rare cases, some population figures are represented by dots for some of the adjoining (non-LA County) cities
All maps use the same grid, showing cities and towns in Los Angeles County, as well as boundary lines of the adjoining counties and some features and delineations of cities surrounding LA County (within the map's borders). A legend of various sized dots is given for each map, from the largest dot representing the highest population figure per dot to the smallest dot representing the smallest population figure this number varies per map. In rare cases, some population figures are represented by dots for some of the adjoining (non-LA County) cities
All maps use the same grid, showing cities and towns in Los Angeles County, as well as boundary lines of the adjoining counties and some features and delineations of cities surrounding LA County (within the map's borders). A legend of various sized dots is given for each map, from the largest dot representing the highest population figure per dot to the smallest dot representing the smallest population figure this number varies per map. In rare cases, some population figures are represented by dots for some of the adjoining (non-LA County) cities
All maps use the same grid, showing cities and towns in Los Angeles County, as well as boundary lines of the adjoining counties and some features and delineations of cities surrounding LA County (within the map's borders). A legend of various sized dots is given for each map, from the largest dot representing the highest population figure per dot to the smallest dot representing the smallest population figure this number varies per map. In rare cases, some population figures are represented by dots for some of the adjoining (non-LA County) cities
All maps use the same grid, showing cities and towns in Los Angeles County, as well as boundary lines of the adjoining counties and some features and delineations of cities surrounding LA County (within the map's borders). A legend of various sized dots is given for each map, from the largest dot representing the highest population figure per dot to the smallest dot representing the smallest population figure this number varies per map. In rare cases, some population figures are represented by dots for some of the adjoining (non-LA County) cities
All maps use the same grid, showing cities and towns in Los Angeles County, as well as boundary lines of the adjoining counties and some features and delineations of cities surrounding LA County (within the map's borders). A legend of various sized dots is given for each map, from the largest dot representing the highest population figure per dot to the smallest dot representing the smallest population figure this number varies per map. In rare cases, some population figures are represented by dots for some of the adjoining (non-LA County) cities
All maps use the same grid, showing cities and towns in Los Angeles County, as well as boundary lines of the adjoining counties and some features and delineations of cities surrounding LA County (within the map's borders). A legend of various sized dots is given for each map, from the largest dot representing the highest population figure per dot to the smallest dot representing the smallest population figure this number varies per map. In rare cases, some population figures are represented by dots for some of the adjoining (non-LA County) cities
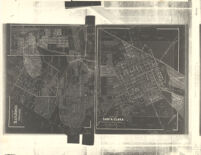
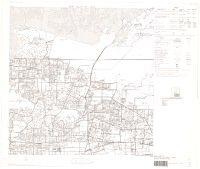
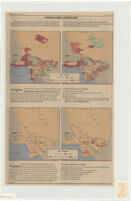
Shows percentage of population for 4 groups for 1980 and 1990. Includes text. Text and tables on verso. From: Los Angeles Times, May 6, 1991, p. B4-B5.
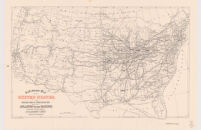
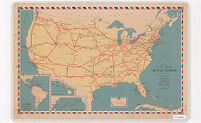
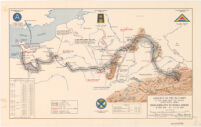
![Map of the United States, Canada, Mexico and the West Indies with Central America, showing all the routes to California with a table of distances [cover]](https://iiif.library.ucla.edu/iiif/2/ark%3A%2F21198%2Fzz001d1csb%2Ffn85mg6h/full/!200,200/0/default.jpg)
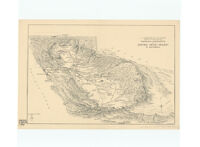
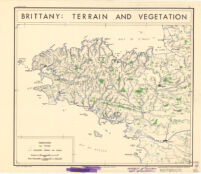
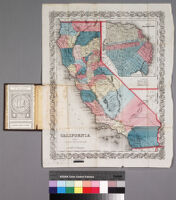
![Bancroft's map of California, Nevada, Utah and Arizona [cover]](https://iiif.library.ucla.edu/iiif/2/ark%3A%2F21198%2Fzz001d1g81%2F52520c5d/full/!200,200/0/default.jpg)