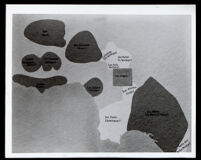
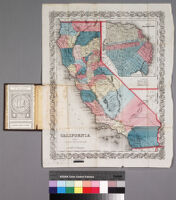
Map showing the locations of California Rancho land grants based on size and on the ethnic classification of the original, or early, recipient of the land grant. It indicates ranchos owned by people of African descent. This includes: Rancho Simi, (Javier, Patricio and Miguel Pico); Rancho San Fernando, (Juan Francisco Reyes); Rancho Topanga Malibu Sequit, (Jose Bartolome Tapia); and Rancho Los Nietos, (José Manuel Nieto).
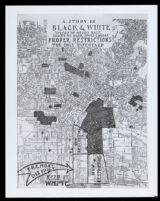
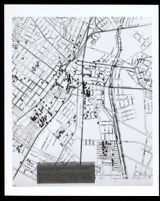
Printed map of the heart of Los Angeles with lines sketched in to show geographic distribution of African Americans, created sometime between 1923 and 1930. The map indicates dense African American populations along Jefferson Blvd, from Arlington to Vermont, and north of Slauson between Central Ave. and the Los Angeles River. This map was used to define what areas of the city to keep for white people to live in, and to block black migration. The practice was a way to prevent integration with African Americans based on the belief that when blacks move into white working class neighborhoods, the property values go down triggering urban blight. This exclusionary practice was known as “red lining”.
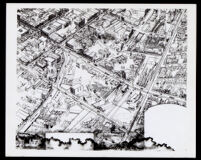
Pictorial map depicting a bird's-eye view of streets, and buildings in downtown Los Angeles with Alameda on the right, San Pedro St. on the left, Second street near the bottom and Requena (renamed Market) near the top. It includes dwellings, commercial structures, and names of streets. It also shows train, and electric rail routes.
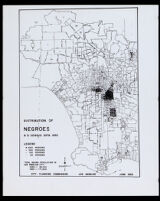
Demographic map with dark push pins placed in areas where African Americans were living in the city of Los Angeles circa 1896. Scattered population grouping, but the densest locations are the streets north of Pico Blvd., both sides of Central Ave., north to Aliso St., and east to the Los Angeles River.
![Bancroft's map of California, Nevada, Utah and Arizona [cover]](https://iiif.library.ucla.edu/iiif/2/ark%3A%2F21198%2Fzz001d1g81%2F52520c5d/full/!200,200/0/default.jpg)