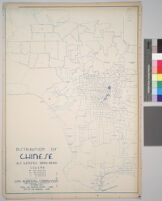
Maps showing distribution of racial and national groups in the Los Angeles area, according to the 1940 United States census: Distribution of Chinese, U.S. Census data, 1940
Item Overview
- Title
- Maps showing distribution of racial and national groups in the Los Angeles area, according to the 1940 United States census: Distribution of Chinese, U.S. Census data, 1940
- Date Created
- 1943
- Date
- 1943
- Publisher
- Los Angeles (Calif.). City Planning Commission
- Language
- English
- Collection
- Maps Showing Distribution of Racial and National Groups in Los Angeles, according to the 1940 United States Census
Notes
- Description
-
All maps use the same grid, showing cities and towns in Los Angeles County, as well as boundary lines of the adjoining counties and some features and delineations of cities surrounding LA County (within the map's borders). A legend of various sized dots is given for each map, from the largest dot representing the highest population figure per dot to the smallest dot representing the smallest population figure this number varies per map. In rare cases, some population figures are represented by dots for some of the adjoining (non-LA County) cities
Digitization took place as part of the California Cultures Project.
Summary of findings: "Total Los Angeles County, 5,330 City of Los Angeles, 4,736"
Scale: 2 3/4 mi. to the inch
Physical Description
- Extent
- 1 map
- Dimensions
- 67 x 47 cm.
Find This Item
- Repository
- University of California, Los Angeles. Library. Department of Special Collections
- ARK
- ark:/21198/zz001d3462
- Manifest url
-

Access Condition
- Rights statement
- public domain